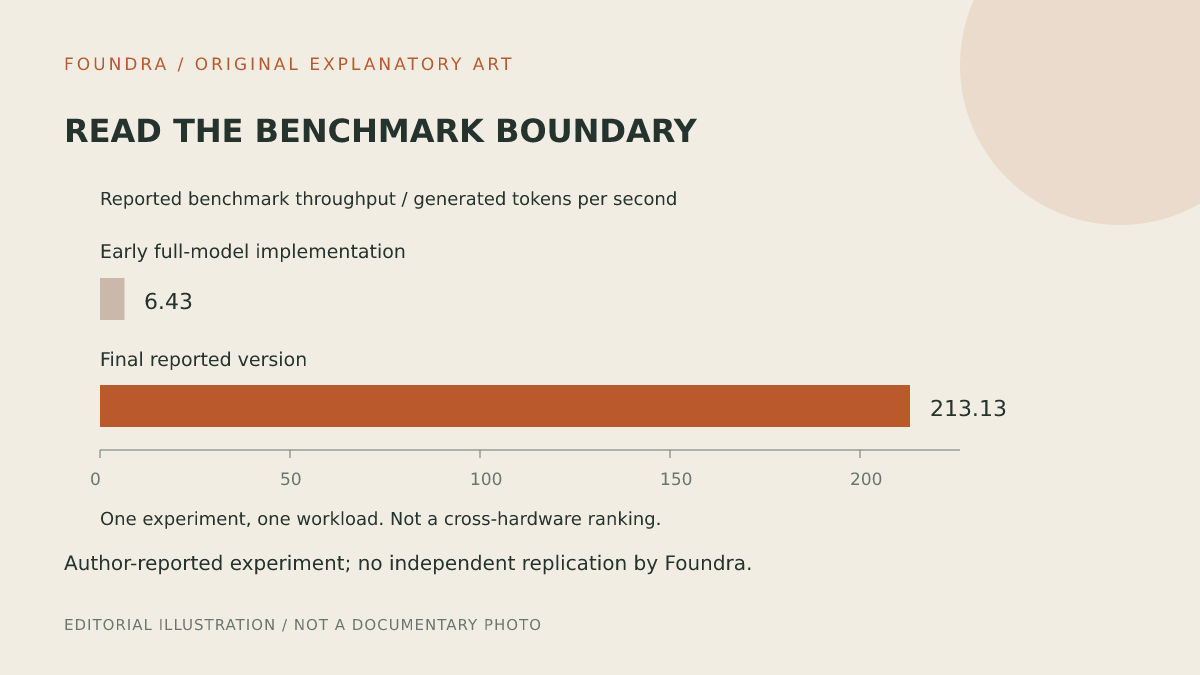
The reported gain is against the experiment’s early implementation, not a universal hardware benchmark or a production-readiness certificate.
The starting line: 6.43 tokens a second
The first full-model implementation was running, but slowly. In Ankit Gupta’s account, his FPGA benchmark began at 6.43 generated tokens per second. The final reported version reached 213.13. Between those endpoints was an optimisation exercise carried out with coding agents—not the fabrication of a new commercial chip. His November 20 write-up turns that development history into a technical case study.
All measurements here are Gupta’s reported results, not tests reproduced by Foundra. The approximately 33-fold improvement compares the project with its own starting implementation. Read that denominator as the beginning of a development process: it shows how much the implementation changed, without establishing where it sits against every alternative that an engineering team could choose.
The test card: eight chats, three turns
Gupta dates the comparison measurements to November 15 and says they replay an eight-chat, three-turn benchmark. Publication on November 20 makes the write-up a new disclosure of earlier experimental work, rather than evidence that the tests took place that Friday. Keeping the two dates separate preserves what the source actually reports.
For a builder reading the table, the workload is as important as the speed. A repeated task can help expose changes between implementations; it cannot represent every prompt, conversation or deployment pattern merely because it returns a precise result. The practical reading is to ask whether that task resembles the intended application before treating its throughput as an operating forecast.
The hardware itself is an existing cloud platform. An FPGA provides reconfigurable hardware; AWS’s official F2 documentation describes an environment for developing and deploying it in the cloud. Gupta’s exercise therefore belongs to implementation and optimisation, not to a semiconductor manufacturing milestone. That distinction clarifies what an interested developer would actually be evaluating.
How to read this experimental result
Define the baseline
The reported 33× improvement compares the final FPGA implementation with its own early full-model implementation.
Check the task
The author’s comparison uses an eight-chat, three-turn workload and a pinned CPU output reference.
Keep limits visible
The GPU comparisons do not meet the same exact-output criterion; the author does not recommend this setup for production.
The output check: a pinned reference
The author counts turns whose outputs match a pinned CPU reference. His table distinguishes exact-output configurations from GPU comparisons that did not meet that same criterion, and he notes that each alternative did not receive the same optimisation loop. The table is consequently not a controlled universal ranking of hardware. It is a project comparison with declared differences between the entries.
Exact matching answers whether one implementation reproduces a chosen reference. As analysis, that is separate from whether a response solves the user’s problem, and separate again from whether the serving system is reliable. Those distinctions give the test a useful, limited role: an engineer can inspect implementation consistency without mistaking it for an application-quality assessment.
The longer run changes the view
Gupta also supplies a context-growth comparison. In his reported full-context runs, version r8 finishes in 77.6 seconds and r9 in 77.8 seconds; he describes them as roughly tied. The accompanying notes identify some short-context figures as coming from separate shorter runs. The final implementation’s headline throughput should not be substituted for a constant speed across an entire long generation.
That is a particularly useful comparison for a prospective product decision. Improving one region of a workload need not shorten its total duration. A team interested in lengthy conversations would therefore read the full-run result differently from a team interested in short responses. This is an interpretation of the disclosed test boundary, not a claim that either application has been validated on this setup.
Tokens per second and full-run wall-clock time answer different questions. One describes output rate under specified conditions; the other captures how long a particular generation took. The latter comparison therefore belongs beside, rather than underneath, the most eye-catching speed figure.
Where the experiment stops
Gupta explicitly declines to recommend this particular FPGA setup and its 8,192-token context model for production. His account is instead a report of exploration: coding agents helped him attempt low-level hardware work outside his previous experience. The evidence supports that first-person account, not a guarantee that a different founder could reproduce its result or dispense with engineering judgement.
The case study is most valuable when read as a set of separate answers. The baseline records implementation progress; the workload defines the task; the reference check describes output consistency; the longer run exposes a different performance boundary. Together they make a reported experiment intelligible. They do not need to become a universal chip-victory claim to be useful to someone deciding what to build.
Sources
- First-person FPGA experiment and benchmark disclosure ↗ Ankit Gupta · Primary source
- Official F2 instance documentation; background only ↗ Amazon Web Services · Primary source
Have additional information? Request a correction.