Keep acquisition scope and reported-versus-adjusted measures visible when reading SaaS growth.
₹745.4 crore of revenue is only the first comparison
RateGain's November 5 results contain a striking mismatch in growth rates. Operating revenue for Q2 FY27 rose 152.6% to ₹745.4 crore, while reported profit after tax rose 46.5% to ₹74.7 crore. A larger business produced more absolute profit, but profit did not increase at the same pace as revenue.
The company's financial table makes the denominator visible. Reported PAT margin was 10.0%, against 17.3% in the year-earlier quarter. Higher absolute earnings and a lower net-profit margin are not contradictory. They describe different aspects of performance: how much was earned, and how much remained from each unit of revenue.
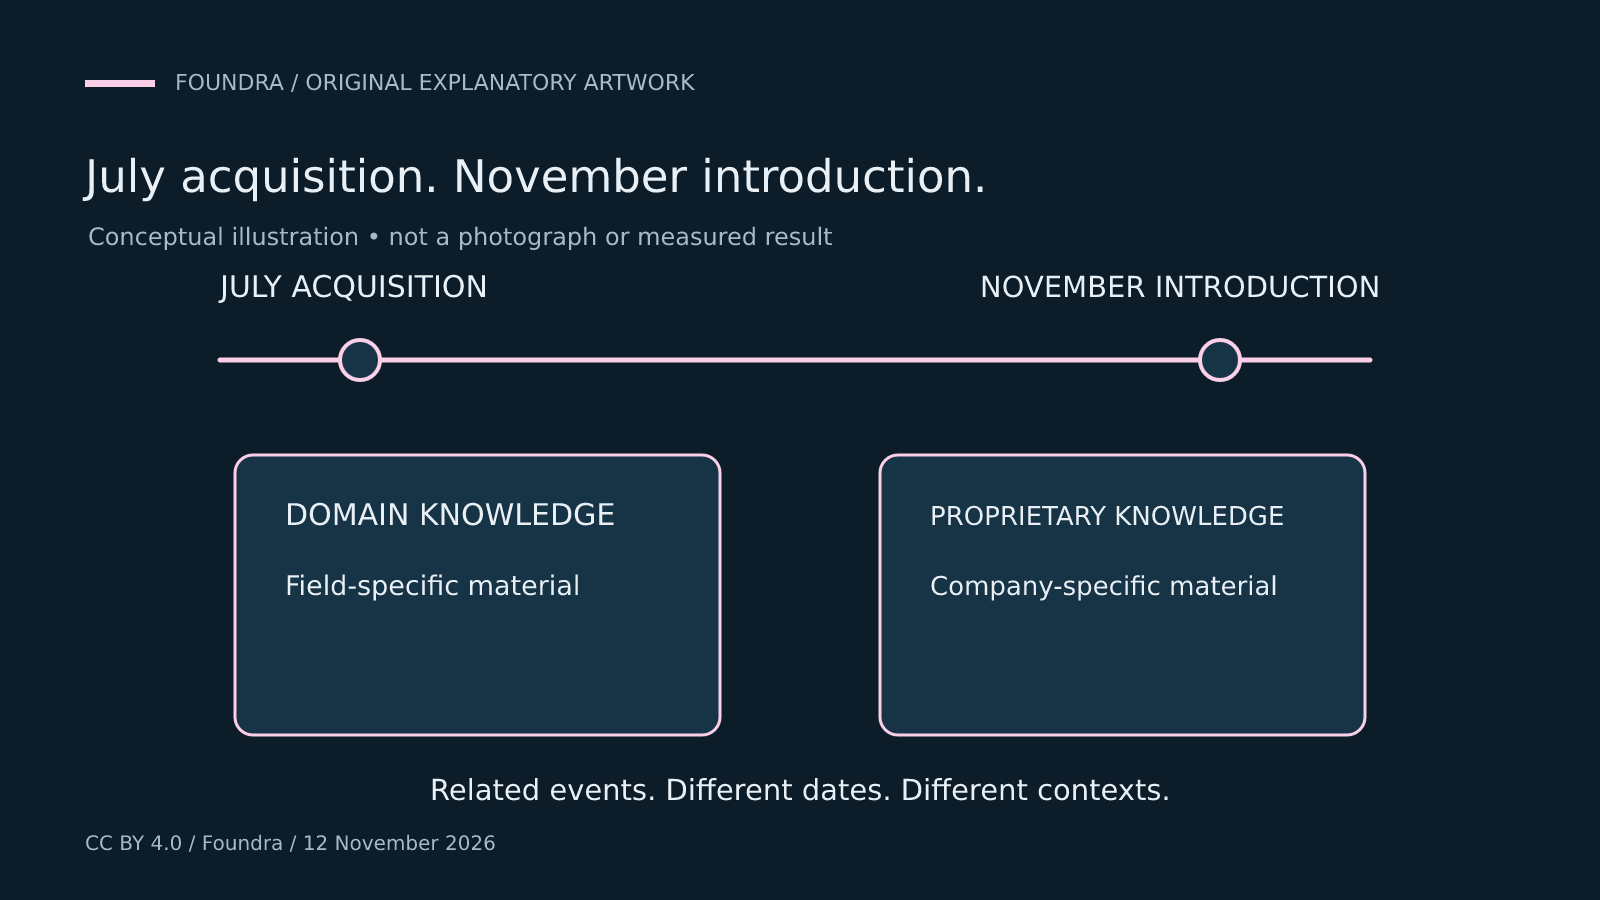
There is another comparison to establish before calling the revenue increase organic. RateGain says the results reflect the scale of the combined RateGain and Sojern platform. The fresh announcement is the quarter's results, not a newly completed acquisition. The consolidation boundary is essential context for the growth percentage.
The release reports first-half operating revenue of ₹1,530.4 crore, compared with ₹568.0 crore a year earlier. That is a six-month measure, while ₹745.4 crore is a quarterly one. Neither should be extrapolated into an annual revenue figure without saying that an extrapolation has been made and considering its assumptions. This article makes no annual projection.
Reported and adjusted measures should remain side by side
RateGain reports EBITDA of ₹153.0 crore and adjusted EBITDA of ₹169.1 crore for the quarter. The corresponding margins are 20.5% and 22.7%. At the net-profit level, reported PAT is ₹74.7 crore, while adjusted PAT is ₹90.8 crore.
The adjustment is not an unexplained label. RateGain says EBITDA and PAT are adjusted for deferred deal consideration related to the Sojern acquisition, with the expense to be incurred for three years ending in Q3 FY29. That disclosed duration makes it important to show the reported measures rather than treating the adjustment as something readers need never revisit.
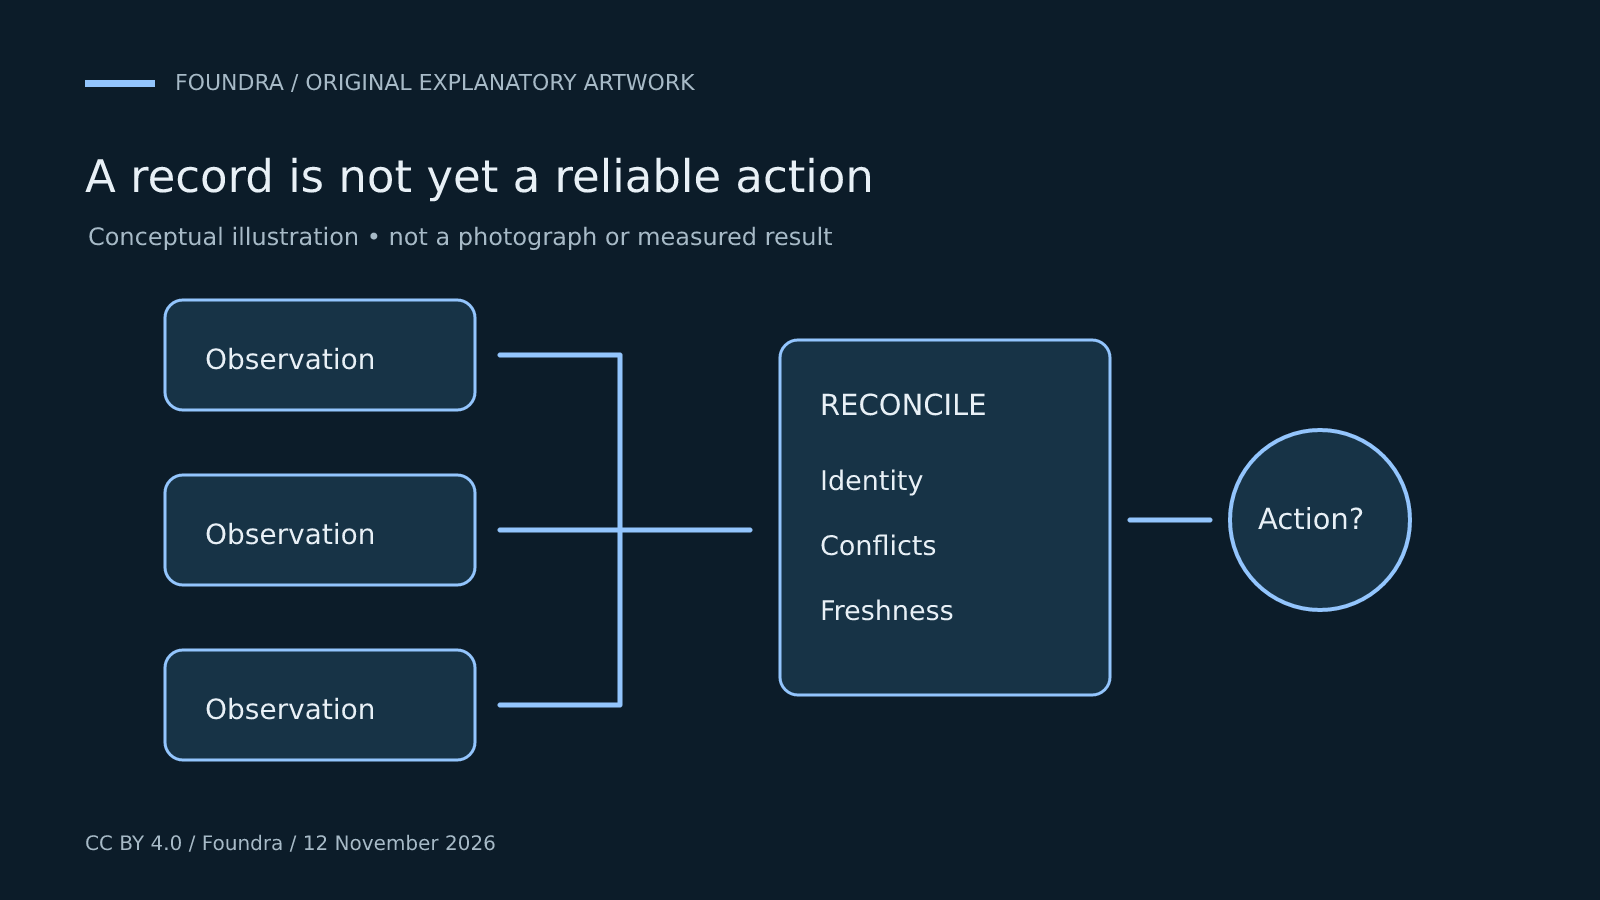
An adjusted measure can help explain management's view of operating performance, but it does not replace the reported result. Conversely, acknowledging an adjustment does not by itself imply that the business's underlying operations are weak. The useful task is reconciliation: identify the item, retain both measures and understand which question each answers.
The growth rates also differ at the EBITDA level. The table shows reported EBITDA rising 185.4%, while adjusted EBITDA rises 215.4%. Their year-earlier figures are both ₹53.6 crore, but the current-quarter adjustment changes the numerator. That is a specific reason the two percentage increases diverge, rather than a reason to alternate between them without explanation.
Margins need the same care. Subtracting the reported PAT margin of 10.0% from the adjusted PAT margin of 12.2% gives a 2.2-percentage-point difference, using the company's rounded table. That is not a 2.2% increase in profit. Keeping percentage changes and percentage-point differences separate prevents another common distortion in results comparisons.
The same discipline prevents an inaccurate headline. Adjusted PAT rose 78% to ₹90.8 crore; reported PAT rose 46.5% to ₹74.7 crore. Mixing the first growth rate with the second profit figure would create a result that appears nowhere in the company's table.
For SaaS comparisons, acquisition scope adds a further limitation. A consolidated company and an organically expanding company can show similar headline growth while following different paths. Aligning their business perimeters and adjustments would be necessary before using those rates to rank customer demand or operational efficiency.
Read the quarter without mixing measures
Revenue perimeter
₹745.4 crore operating revenue; the release connects growth to the combined platform.
Reported PAT
₹74.7 crore, up 46.5%; not the adjusted figure.
Adjusted PAT
₹90.8 crore, up 78%; includes specified acquisition-related adjustments.
Next comparison
Like-for-like performance needs more than the consolidated growth headline.
Cash generation, debt and integration answer different questions
The release reports first-half free cash flow of ₹282.3 crore and net debt of ₹494.0 crore at September 30. These figures should not be treated as interchangeable. Cash flow describes movement over a period; net debt describes a position at a particular date.
The quarter-end debt figure does not establish the complete future debt schedule, financing cost or capacity for another acquisition. It does, however, keep the financing of the combination visible alongside the larger revenue base. A discussion focused solely on growth would miss that part of the transaction's continuing financial footprint. It should not be used to imply an unchanged debt balance at the time readers see the results.
Management's second-half priorities include strengthening Sojern's product, go-to-market and AI capabilities and cross-selling across the combined customer base. Those are plans for generating more value from the enlarged platform, not reported conversion rates or guaranteed incremental revenue.
In analytical terms, cross-selling is a different growth mechanism from buying another revenue stream. It asks existing customers to adopt additional products. Its contribution would become clearer through evidence of adoption and like-for-like performance; the consolidated increase does not isolate it today.
RateGain's quarter can therefore be read through three lenses rather than a single percentage. The revenue table shows a substantially larger combined business. The profit table shows both greater absolute profit and differences between reported and adjusted margins. The cash and debt disclosures retain the cost of financing that expansion. Together they offer a more useful account of this results announcement than either celebrating triple-digit growth as wholly organic or dismissing it because an acquisition helped create it.
Sources
- RateGain: Q2 FY27 financial results ↗ RateGain: Q2 FY27 financial results · Primary source
- Inc42: RateGain Q2 profit report ↗ Inc42: RateGain Q2 profit report
Have additional information? Request a correction.